Plan your app's tech.
See the bill first.
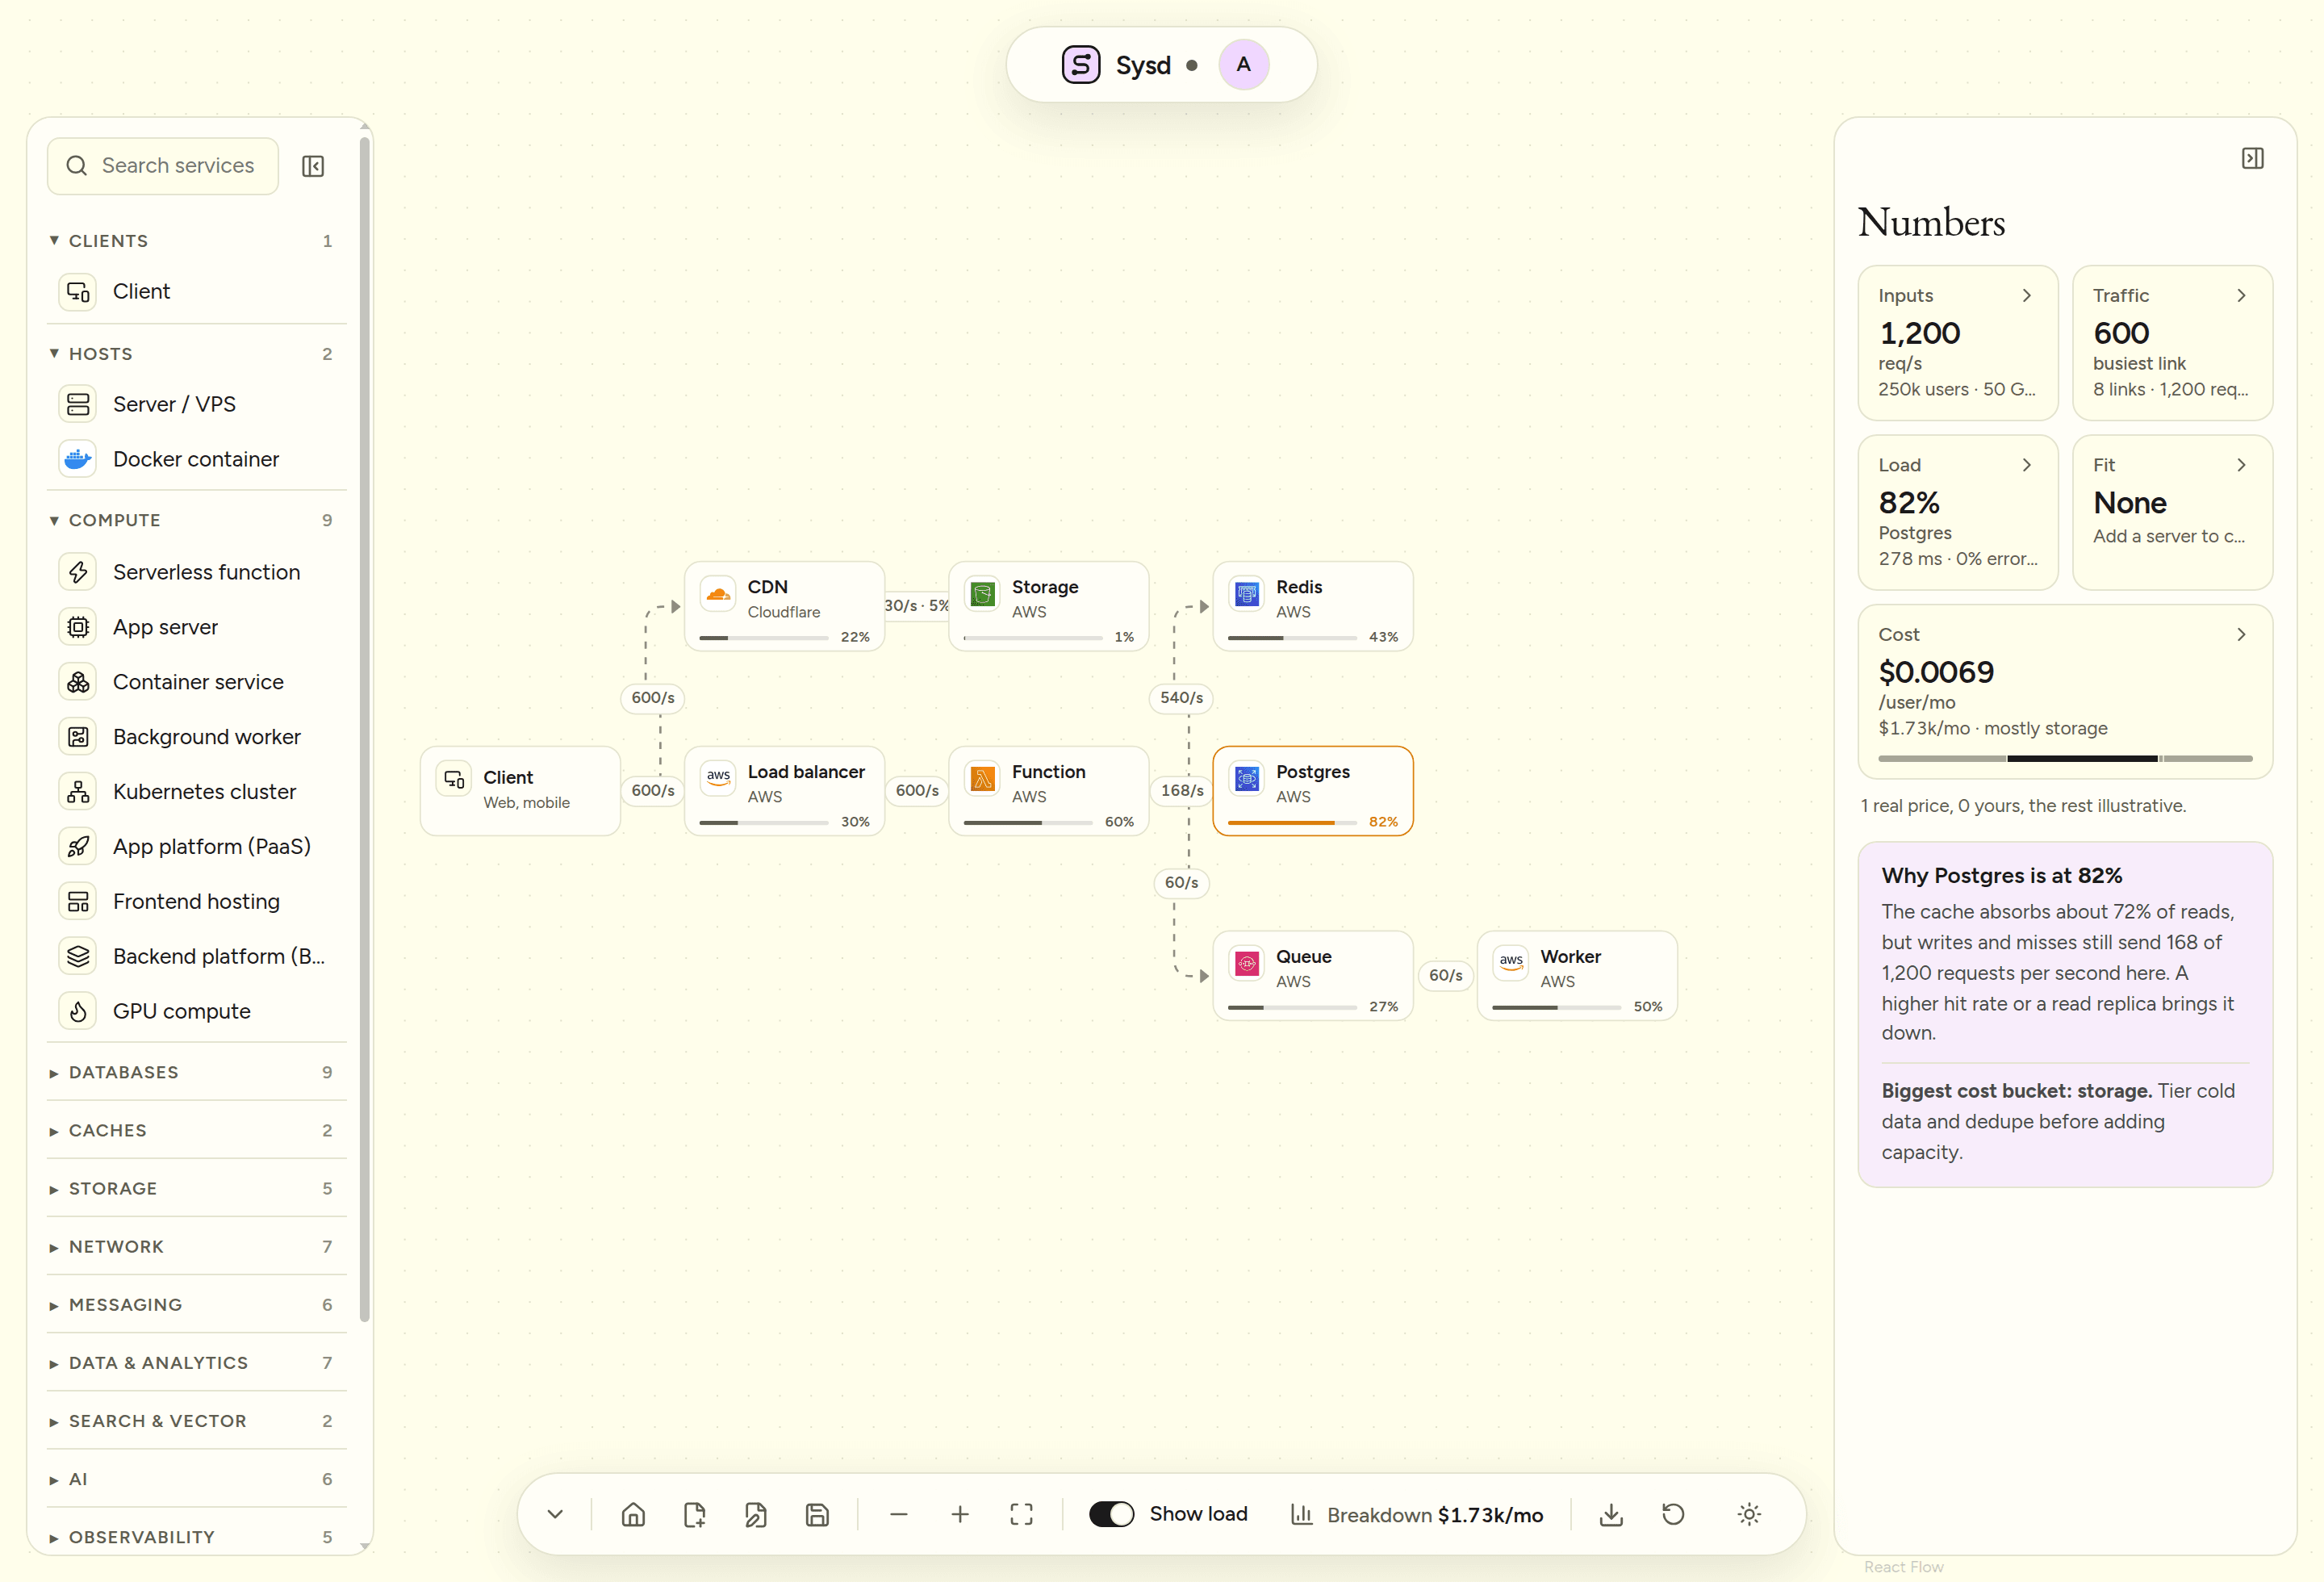
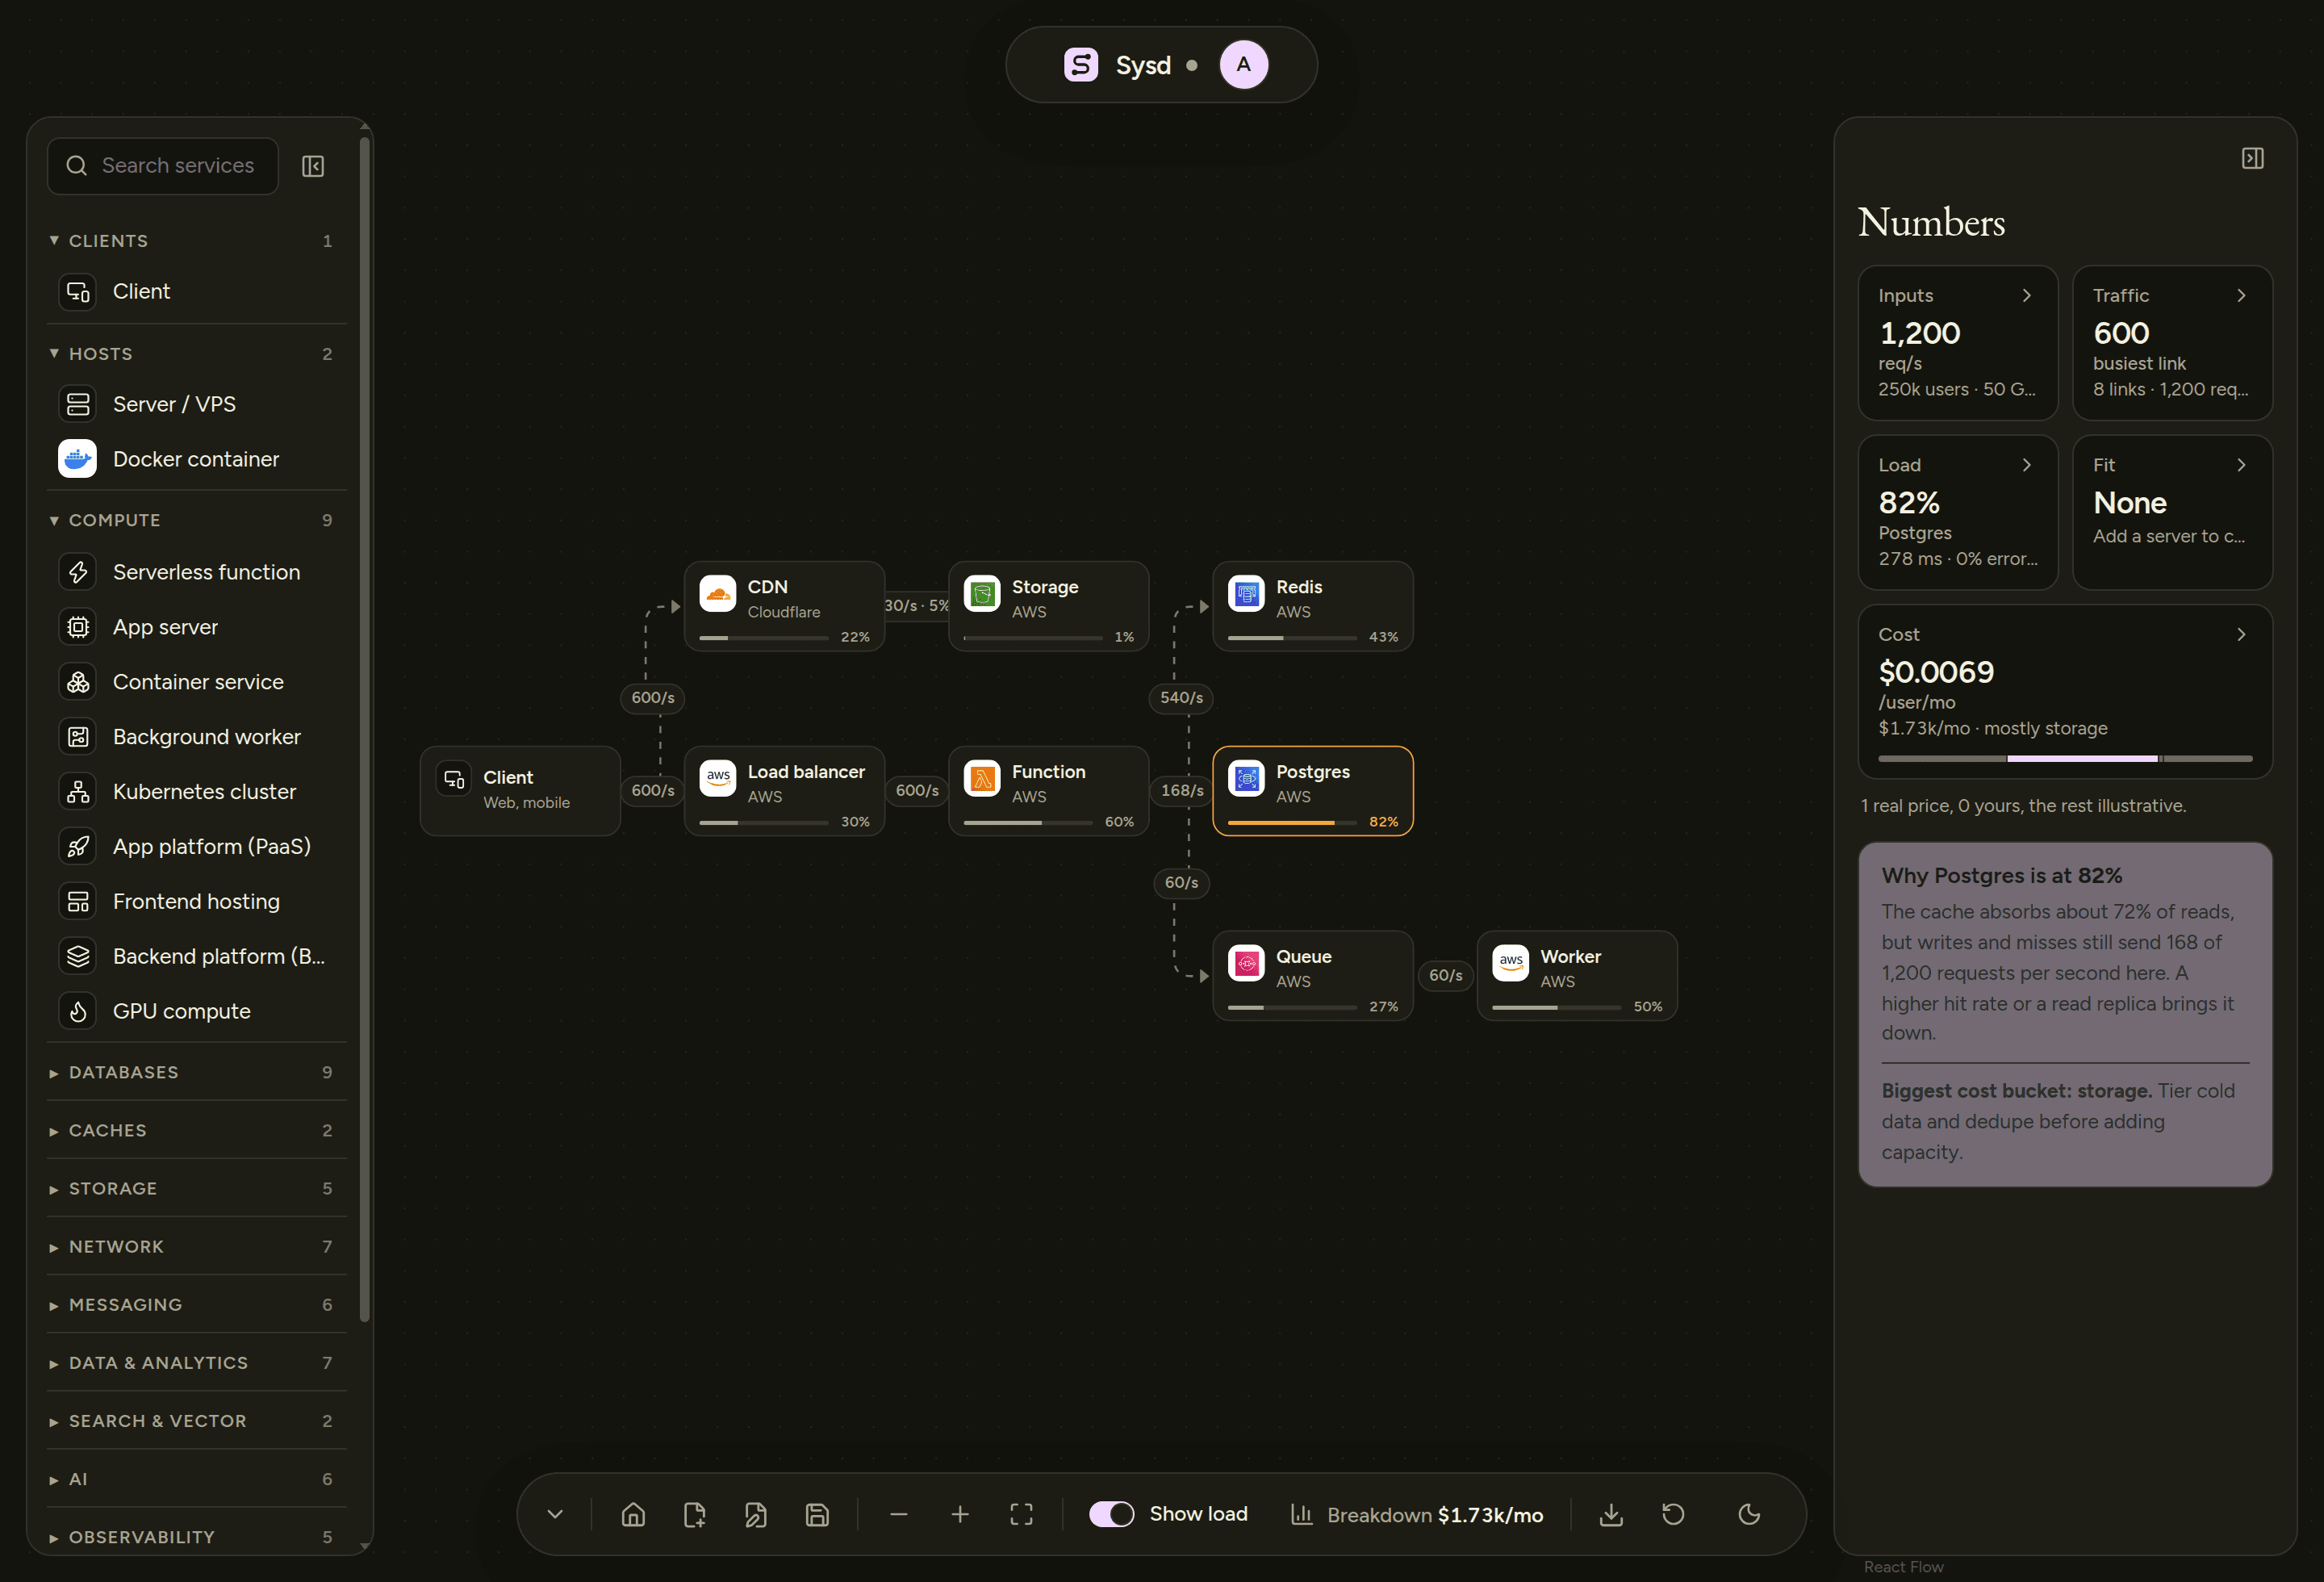
Drag in the pieces your app needs, say how many people will use it, and see what it will cost and where it will struggle. No engineer needed to get started.
Open to everyone while we build. Sign in with GitHub or Google.
Pick from the tools and clouds you already know
- AWS
- Google Cloud
- Azure
- Cloudflare
- Neon
- Supabase
- Hostinger
- Hetzner
- DigitalOcean
- Vercel
- MongoDB
- Redis
- Kafka
- Stripe
- Razorpay
- OpenAI
- Anthropic
- Datadog
- Grafana
- Docker
- Snowflake
- Databricks
- GitHub
- Backblaze
Will it run on the server you are eyeing?
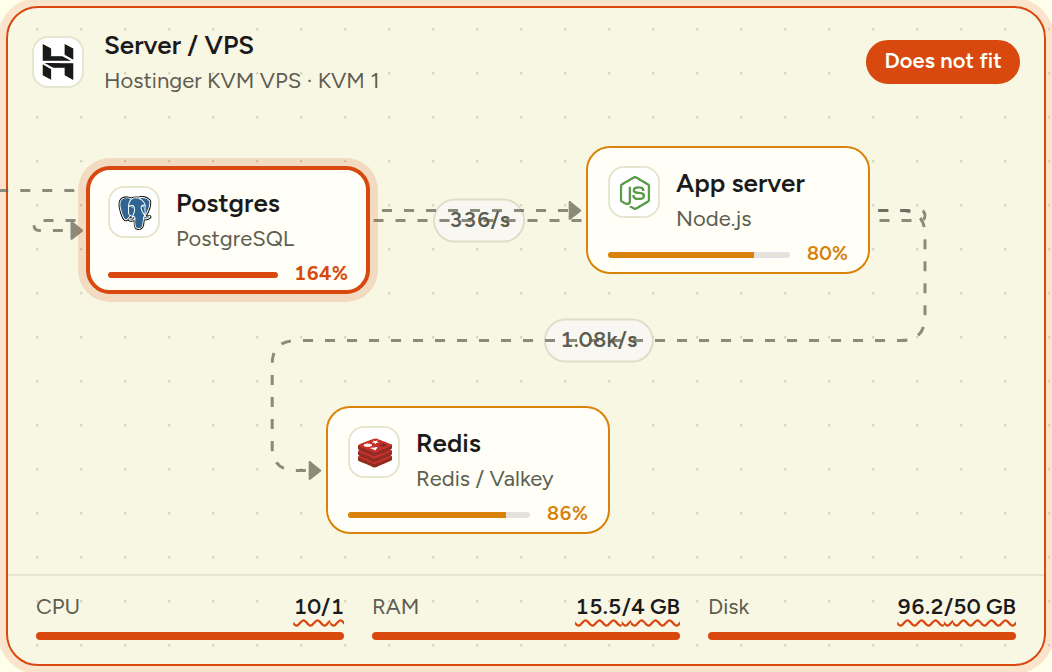
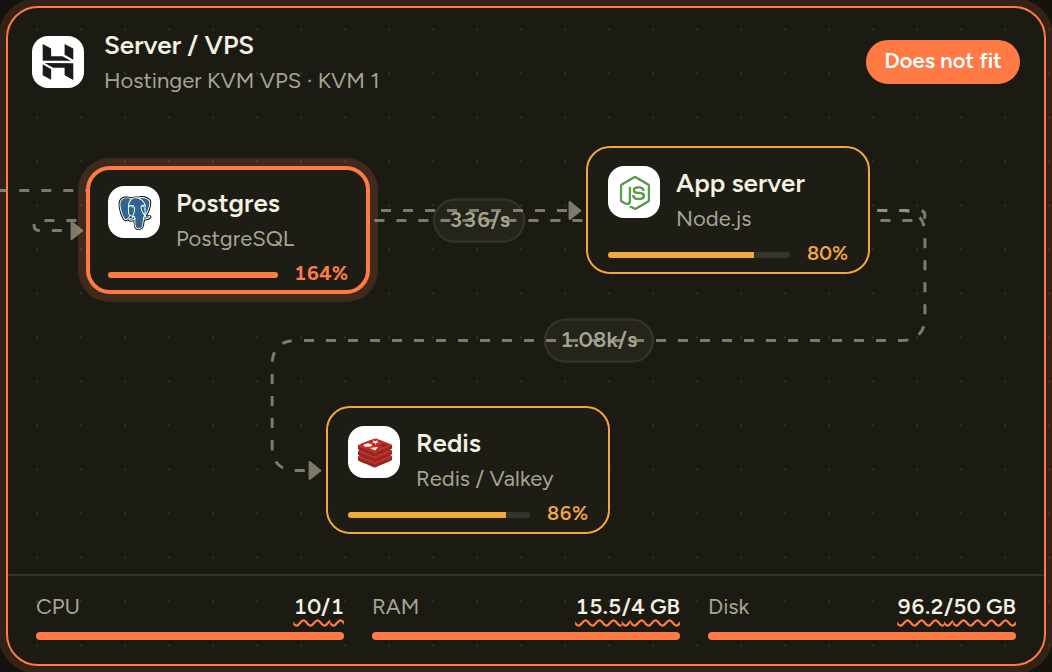
Put a database, your app and a cache on a small server, and Sysd tells you straight: it will not fit, and here is what runs short. Choose the next size up and watch the warning disappear. No guessing, and no surprise upgrade the week you launch.
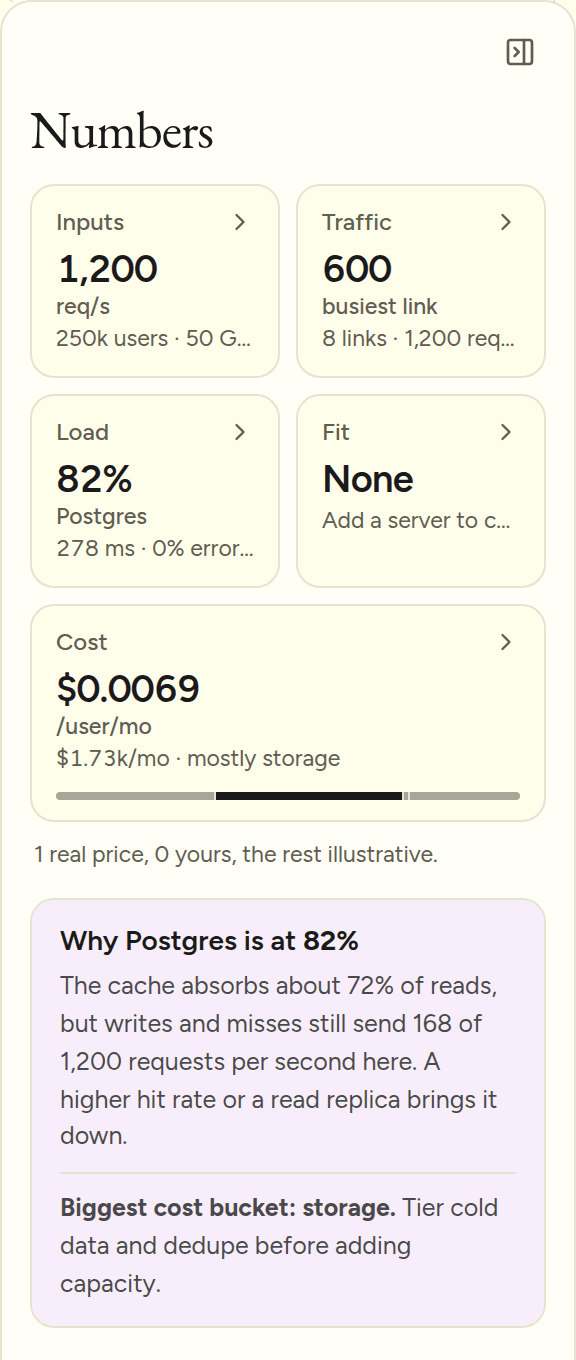
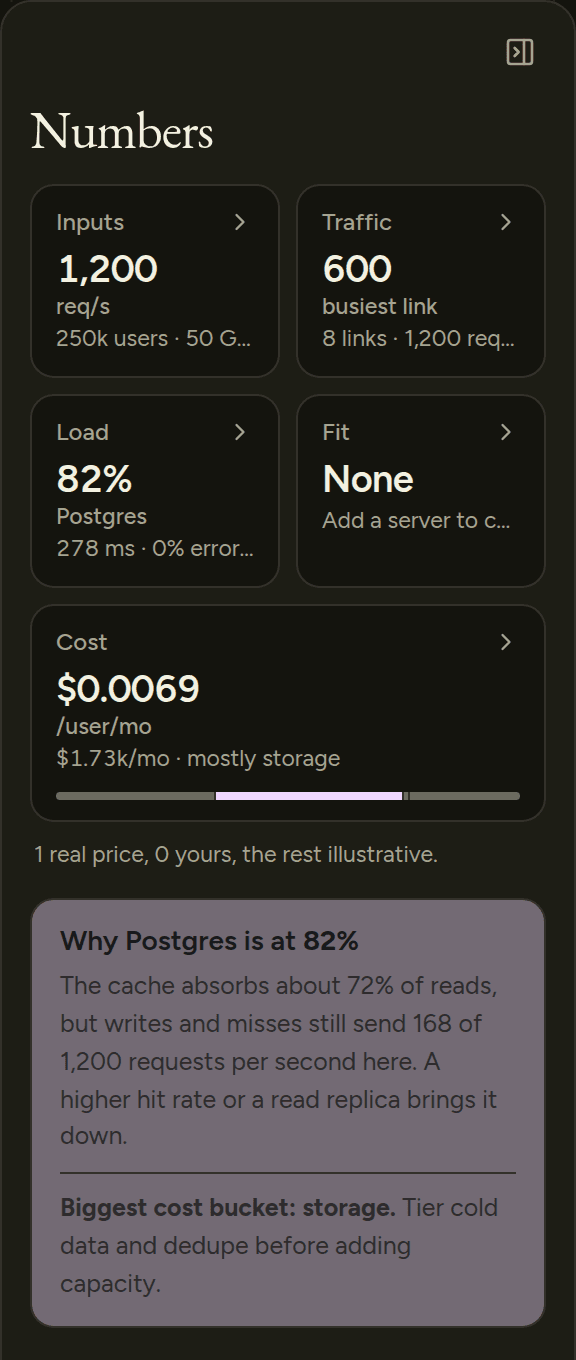
See your monthly bill, and where it goes.
Every design shows what each user costs you per month, split into servers, storage, data transfer, managed services and people's time. The biggest slice is called out, with the usual way to shrink it.
When something runs hot, a short note explains why in plain words. Figures marked illustrative are placeholders until real prices load for that provider.
How it works
Sketch your idea.
Drag in the pieces: a database, a cache, a payment service. Connect them the way data flows. A server can hold other pieces inside it.
Say how busy it gets.
How many people, how many requests a second, how much data. Every piece shows how full it is.
Fix the weak spots.
Each hot spot explains itself. Swap a plan or a provider and the cost and fit update instantly.
Numbers you can check.
Every real price links back to the page it came from and the day we looked, so you never have to take our word for it. Anything we have not verified yet is clearly marked illustrative, so you always know what is solid and what is a placeholder.
Try your idea on the canvas.
Open the canvasThe Starter plan is open to everyone. A Pro plan is planned.